Scientific Visualization
A image scientific illustration is worth a thousand words.
Cartopy
Publication ready, effective, easy
Paraview
Lorem ipsum dolor sit amet, consectetur adipisicing elit.
WRF
Tailored visualization
WRF-Paraview Toolkit
Scientific robustness meets advanced VTK visualization
Copernicus
Lorem ipsum dolor sit amet, consectetur adipisicing elit.
Copernicus
Lorem ipsum dolor sit amet
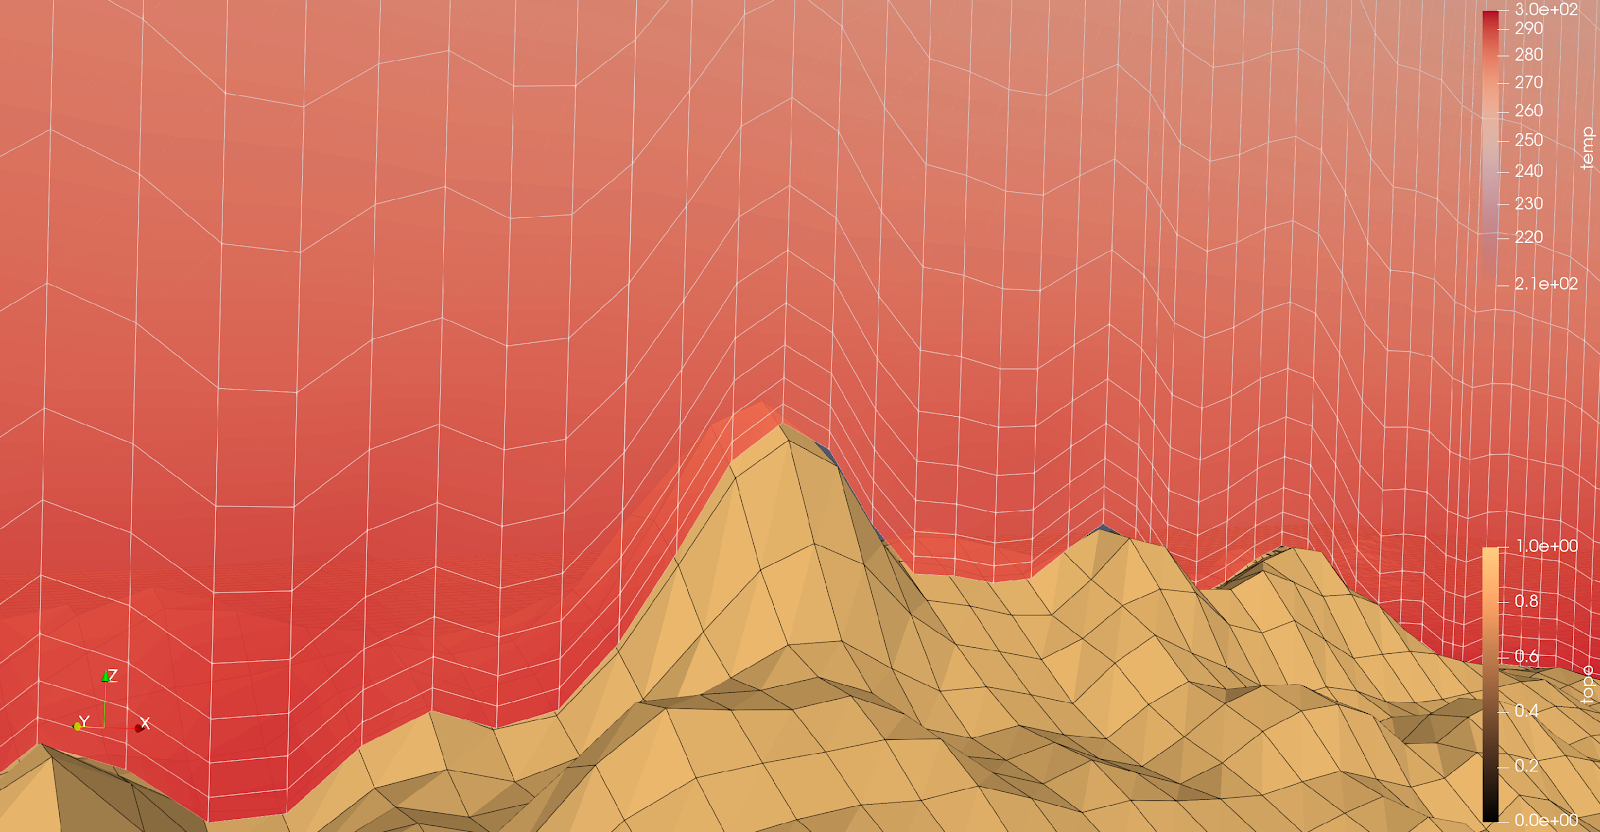
KITWARE blog post. WRF data in PARAVIEW
This post demonstrates how to visualize WRF climate data in ParaView using a Programmable Filter to restore terrain-following vertical levels. By pre-processing and reassigning vertical coordinates, 3D variables like wind, temperature, and NO₂ accurately adhere to underlying topography, eliminating unrealistic intersections. We cover grid interpolation, high-resolution topography from GEBCO, and netCDF preparation, with examples over Mount Troodos showing low-altitude atmospheric patterns and convection. This workflow makes high-resolution WRF simulations directly explorable and analyzable in ParaView. Full post here.
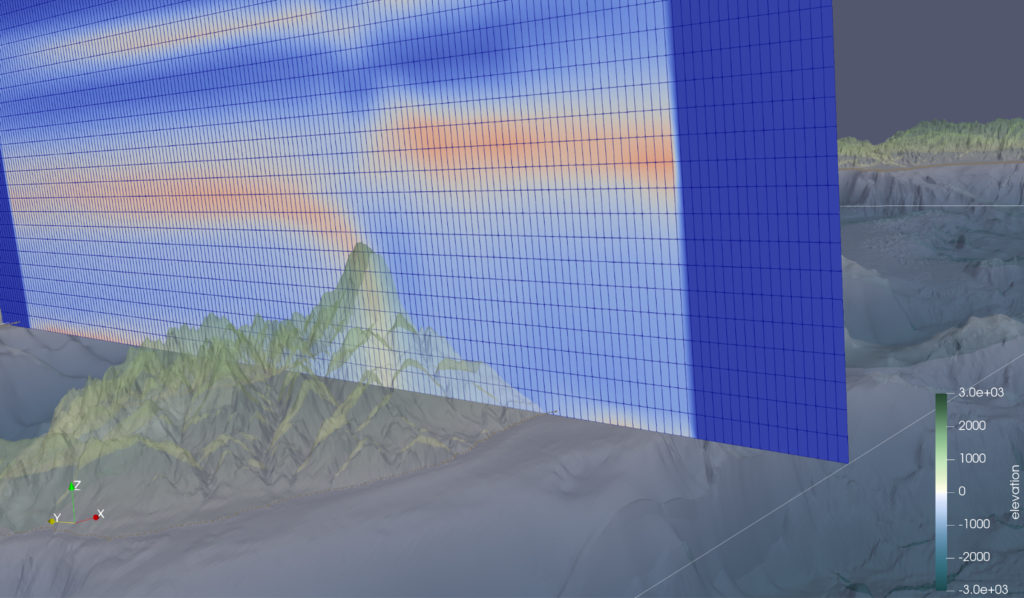
KITWARE blog post. Convert WRF data to vts
This post demonstrates how to visualize WRF and ocean model data in ParaView using pre-processed .vts files. By appending (x, y, z) coordinates directly to variables like temperature, pressure, relative humidity, or salinity, the original model topology is fully preserved, eliminating the need for programmable filters or manual re-gridding. Practical examples include air temperature over the Pentadaktylos mountain ridge in Cyprus and 3D salinity fields in the Mississippi Delta, highlighting phenomena like warm air pockets and freshwater/saltwater interactions. The approach enables direct, plug-and-play visualization in ParaView, where filters such as slice, contour, threshold, and subset can be applied seamlessly to extract meaningful insights from complex 3D datasets. Full post available here.
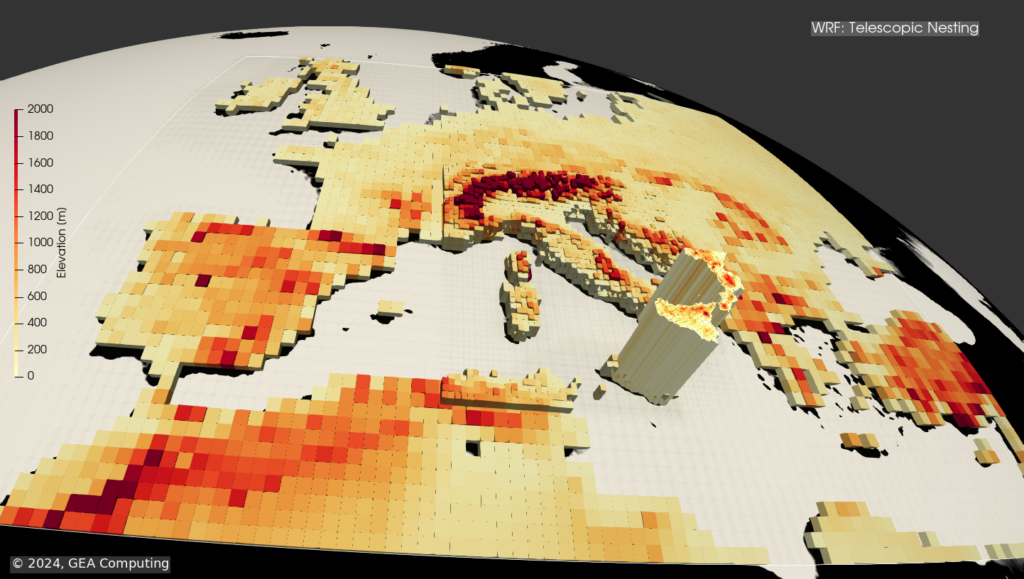
KITWARE blog post. Telescopic nesting
Telescoping nesting of subdomains in Weather Research and Forecasting (WRF) refers to the capability of the model to use multiple levels of nested grids to represent fine-scale features within larger-scale domains. This allows for a more detailed representation of complex atmospheric processes while maintaining computational efficiency. The nested grids in WRF can be configured to cover different spatial scales, with each nested domain providing higher resolution than its parent domain. This enables the model to capture local weather phenomena such as thunderstorms, while also simulating larger-scale weather patterns. Overall, the telescoping nesting of subdomains in the WRF model enhances its ability to simulate a wide range of atmospheric phenomena with high spatial resolution, making it a valuable tool for weather research and forecasting. Read the full post here.
PARAVIEW toolbox: Unlock the potentiality.
This plugin provides a fully automated workflow for visualizing WRF netCDF output in ParaView. It reads raw model output and handles everything—from extracting coordinates to reading variables—vectorized for maximum speed. Built on wrf-python, it ensures reliable, reproducible processing, with both the Python code and ParaView environment encapsulated in a conda environment for easy replication. A dedicated GUI allows users to seamlessly configure scaling, Cartesian or spherical coordinates, and other visualization parameters, making it a true plug-and-play solution for exploring complex WRF datasets. The toolbox is still under development and is nearing official deployment, promising a streamlined, user-friendly experience for high-resolution climate data visualization. Material under preparation: here.
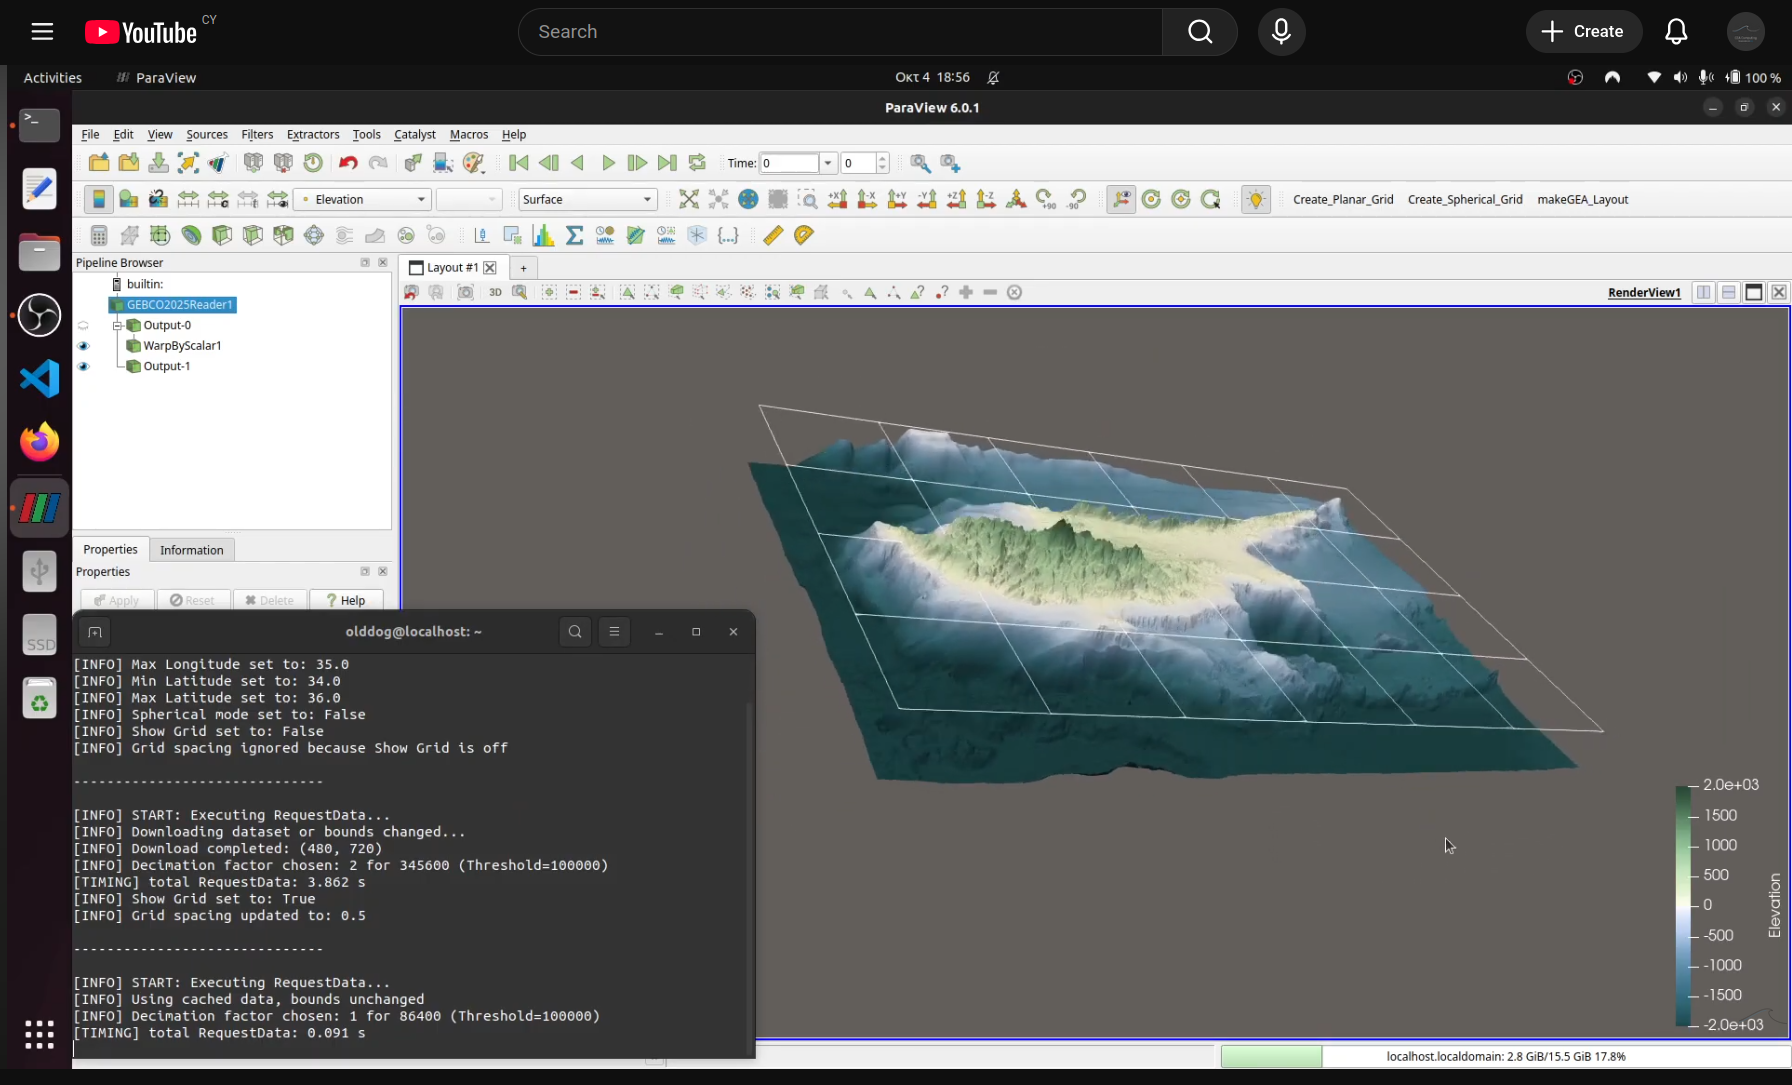
GEBCO, openDAP and PARAVIEW.
Python-based tailored plugins let you extend software exactly to your workflow, automating repetitive tasks and adding custom features.
They are powerful because they seamlessly integrate with existing tools while keeping full control over data processing and visualization.
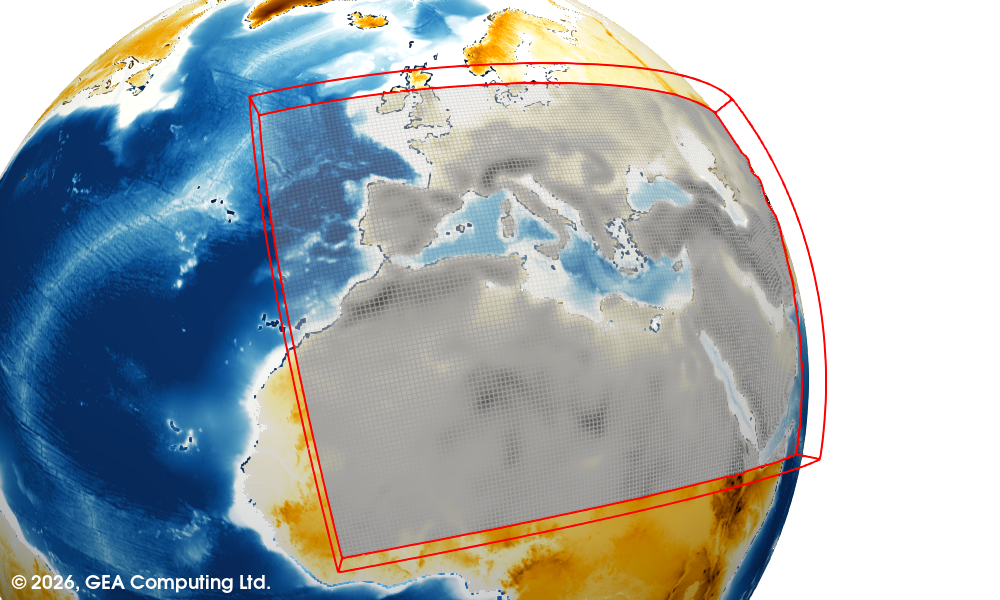
This video showcases a fully integrated ParaView Python plugin for GEBCO 2025
elevation data. Key features include on-the-fly data caching for faster loading, planar or spherical coordinate modes, optional decimation
for smoother visualization, and a configurable grid overlay. Interactive toggles and real-time annotations make it effortless to explore
both ocean and land topography. All datasets are streamed directly from a remote server via OpenDAP within ParaView — no manual file
downloads required. Watch the full video here.